
(Stacker) — Are Californians and East Coast residents eyeing a move to Clarksburg?
The number of homes on the market is well below pre-pandemic levels nationwide, and that scarcity is keeping home prices elevated even as sales have slowed in the past year.
As Americans navigate an ever-complicated market, online house hunting has become an essential part of the process. A 2021 National Association of Realtors report showed 97% of homebuyers used online websites when searching for a home in the United States.
Stacker compiled statistics about people in cities looking to buy homes in Clarksburg using cross-market demand data from Realtor.com. View share is the percentage of views to Clarksburg from each respective metro. Cross-market demand statistics are as of Q4 2022.
Continue reading to see who is looking to move in.

1 / 10
Canva
#10. Sacramento, CA
– View share: 1.5%
– Views to own market: 21.2%
– Views to other markets within own state: 27.7%
– Views to markets within other states: 51.0%

2 / 10
Canva
#9. Atlanta, GA
– View share: 2.0%
– Views to own market: 25.5%
– Views to other markets within own state: 9.3%
– Views to markets within other states: 65.2%

3 / 10
Sean Pavone // Shutterstock
#8. Columbus, OH
– View share: 2.2%
– Views to own market: 50.7%
– Views to other markets within own state: 19.7%
– Views to markets within other states: 29.5%
4 / 10
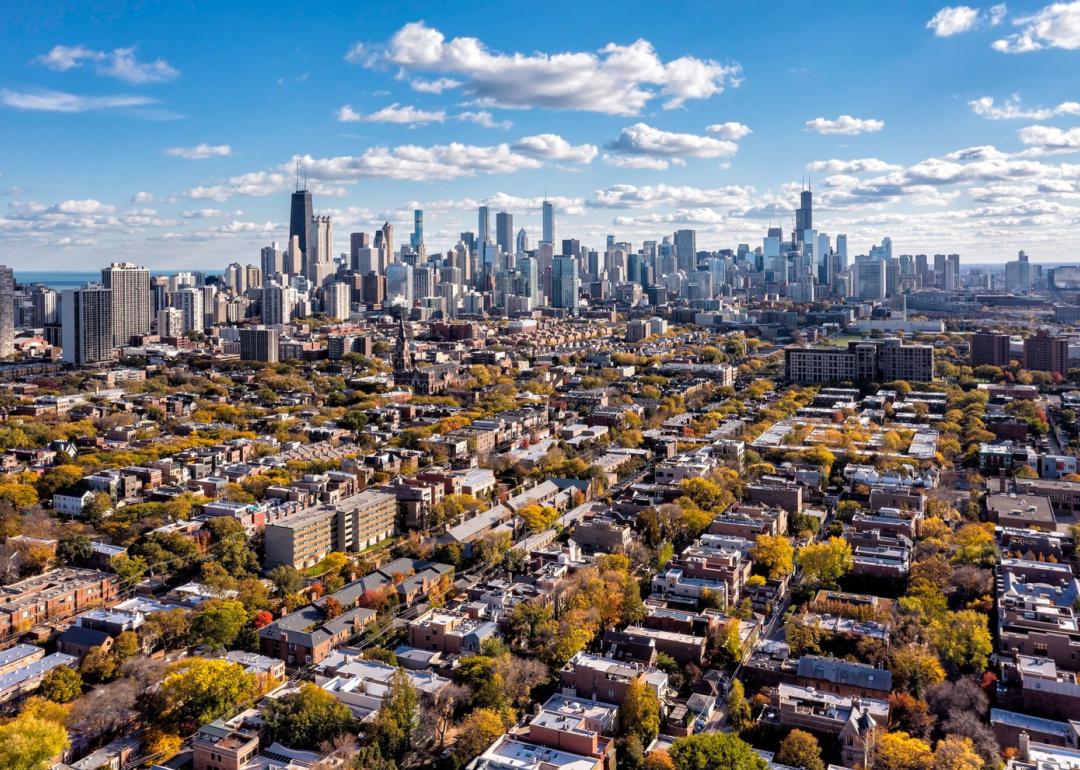
marchello74 // Shutterstock
#7. Chicago, IL
– View share: 2.3%
– Views to own market: 23.5%
– Views to other markets within own state: 5.7%
– Views to markets within other states: 70.7%

5 / 10
Canva
#6. Morgantown, WV
– View share: 4.9%
– Views to own market: 34.8%
– Views to other markets within own state: 25.2%
– Views to markets within other states: 40.1%

6 / 10
w:User:Malepheasant // Wikimedia Commons
#5. Fairmont, WV
– View share: 6.6%
– Views to own market: 39.1%
– Views to other markets within own state: 36.9%
– Views to markets within other states: 24.0%

7 / 10
ESB Professional // Shutterstock
#4. Pittsburgh, PA
– View share: 6.9%
– Views to own market: 57.2%
– Views to other markets within own state: 10.7%
– Views to markets within other states: 32.1%

8 / 10
Andrew J Simcox // Shutterstock
#3. Philadelphia, PA
– View share: 8.2%
– Views to own market: 38.4%
– Views to other markets within own state: 13.9%
– Views to markets within other states: 47.7%

9 / 10
Orhan Cam // Shutterstock
#2. Washington, D.C.
– View share: 14.6%
– Views to own market: 14.3%
– Views to other markets within own state: 5.6%
– Views to markets within other states: 80.0%

10 / 10
Thiago Leite // Shutterstock
#1. New York, NY
– View share: 19.9%
– Views to own market: 22.5%
– Views to other markets within own state: 6.6%
– Views to markets within other states: 70.9%