New MBTA dashboard outlines all of the T slow zones, and there are still a lot of them
While the MBTA lifted blanket speed restrictions earlier this month, slow zones still cover 27% of the tracks.

More than a quarter of the MBTA’s tracks are now covered in speed restrictions, quadrupling the percentage of restricted track that the T reported at the end of January.
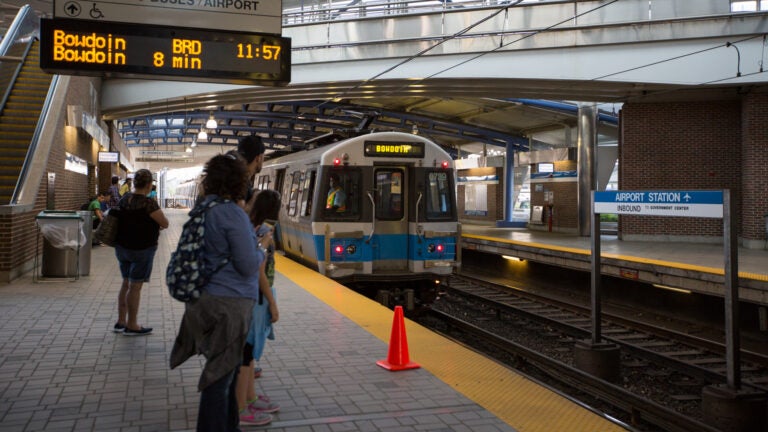
According to T data, there are 221 slow zones in place across all subway lines, accounting for 36.8 miles of track, or 27% of the entire system. These latest figures are reflected on the transit agency’s new Speed Restrictions Dashboard, which gives users a live look at where trains are running slower than normal.
More on slow zones:
The dashboard, which launched Thursday, includes the location, speed limit, and reasoning behind each slow zone on the various subway lines. The dashboard also shows when each slow zone was put in place; the T implemented 175 new restrictions within the last 30 days alone, eliminating 40 restrictions in that same period, according to the data.
The new tool provides daily updates based on the prior day’s data, MBTA interim General Manager Jeff Gonneville said in a press release. Before, the T offered a static dashboard showing speed restriction data from the previous month.
“The dashboard delivers information that is clear and will assist riders in better understanding why they are experiencing slower conditions while riding the T,” Gonneville said in a statement, adding, “We know these restrictions impact riders’ daily commutes and we will continue to be transparent about the ongoing, daily work to improve our transit system.”
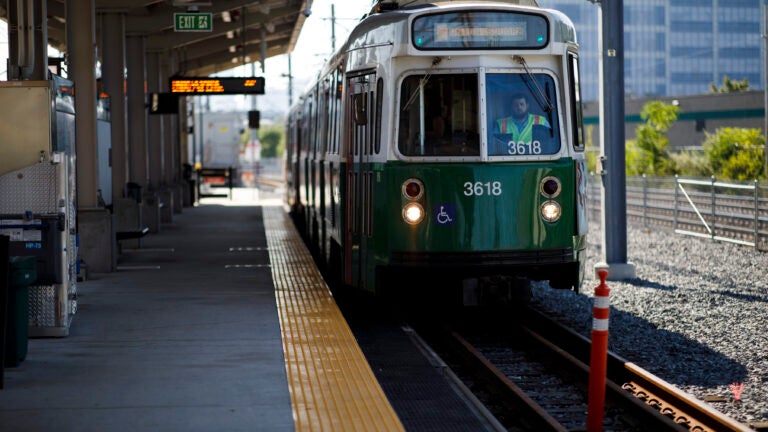
The revamped dashboard comes two weeks after the T capped speeds at 10 to 25 mph across all its lines after discovering that some of the documentation for track repairs was missing or inconsistent. The agency lifted the last of the global restrictions on the Green Line Sunday, implementing localized slow zones as it works to verify repairs.
But depending on the line, T riders may not notice much of a difference yet.
On the Blue Line, for example, 77% of the track remains under speed restriction, compared to 25% each on the Orange and Red lines, and 18% on the Green Line. Twitter user @alex_defronzo shared a video earlier this week showing how easily a bicyclist can outpace the Blue Line along the East Boston Greenway.
Speaking at Thursday’s MBTA Board of Directors meeting, Gonneville noted that the number of slow zones may fluctuate as the T alters the length of restricted track and works to address any necessary repairs.
“It’s important to note that the restricted track speed is an area and a metric that we’re going to be watching very closely,” he said. “The speed restrictions themselves may go up and they may go down on a daily basis.”
MBTA board member Chanda Smart asked Transportation Secretary Gina Fiandaca if she’s satisfied with the way T management is “being held accountable for allowing the system to degrade to such a poor condition.”
Fiandaca replied that she and Gonneville have been in constant contact, describing the systemwide speed restrictions as being in the best interest of T workers and riders.
“I want to be very clear: There is a level of accountability here that we will need and we will evaluate,” Gonneville added.
He emphasized the need for a “full and thorough” investigation to help the T “really determine exactly what the circumstances are that got us to this point and then from there we can make those necessary decisions.”